import numpy as np
import pandas as pd
import matplotlib.pyplot as plt
import matplotlib as mpl
%matplotlib inline

import networkx as nxNetwork Science - UDD
Network projections
Cristian Candia-Castro Vallejos, Ph.D.
Yessica Herrera-Guzmán, Ph.D.
- [1] Data Science Institute (IDS), Universidad del Desarrollo,Chile
- [2] Northwestern Institute on Complex Systems, Kellogg School of Management, Northwestern Unviersity, USA
- [3] Center for Complex Network Research (CCNR), Northwestern Unviersity, USA
import matplotlib.colors as colors
from matplotlib import cm
from matplotlib.colors import ListedColormap,LinearSegmentedColormap
People who contracted COVID
This is a randomly generated dataset to illustrate the construction of heatmap on network centrality.
In this network, nodes are individuals and they are linked if they were infected with the same COVID variant.
data = pd.read_csv('COVID_people.csv')g = nx.Graph()data.head(2)| Source | Target | |
|---|---|---|
| 0 | Charlie | Sam |
| 1 | Charlie | Nina |
g = nx.from_pandas_edgelist(data, source='Source', target='Target')print(nx.info(g))Graph with 59 nodes and 1265 edgeslayout = nx.spring_layout(g, k=0.1, iterations=50)nx.draw(g)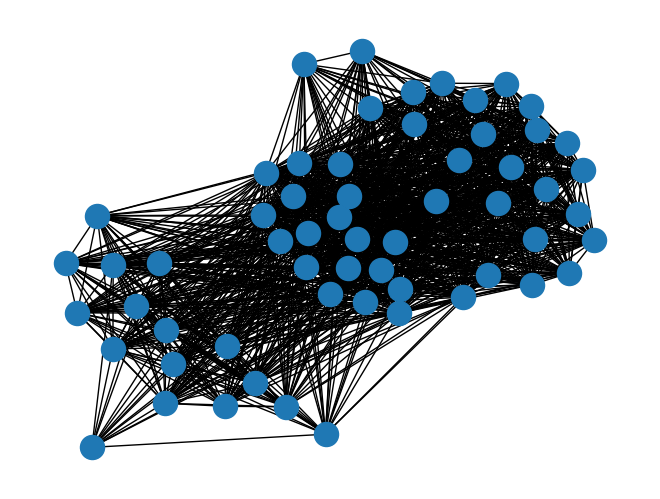
Define the function to draw the network
def draw(G, pos, measures, measure_name):

    nodes = nx.draw_networkx_nodes(g, layout, node_size=80,
                                   edgecolors='black',
                                   linewidths=0.4, cmap='YlGnBu',
                                   node_color=list(measures.values()),
                                   nodelist=measures.keys())
    nodes.set_norm(colors.SymLogNorm(linthresh=0.01, linscale=1, base=10))
    # labels = nx.draw_networkx_labels(G, pos)
    edges = nx.draw_networkx_edges(g, layout, edge_color="darkgray", alpha=0.2)

    plt.title(measure_name)
    plt.colorbar(nodes)
    plt.axis('off')
    plt.show()
draw(g, layout, nx.degree_centrality(g), 'Degree Centrality')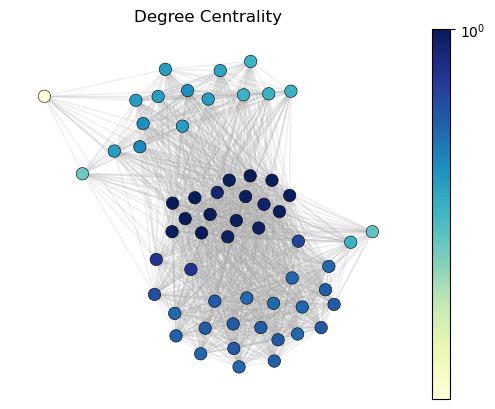
draw(g, layout, nx.betweenness_centrality(g), 'Betweenness Centrality')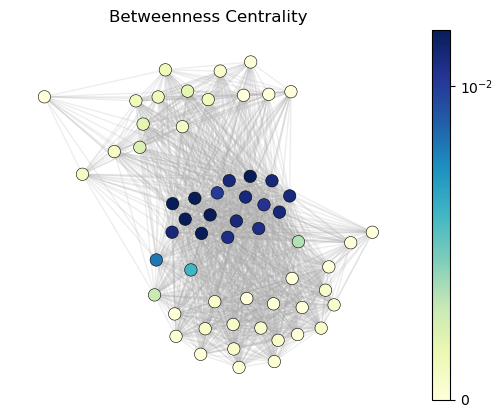
draw(g, layout, nx.closeness_centrality(g), 'Closeness Centrality')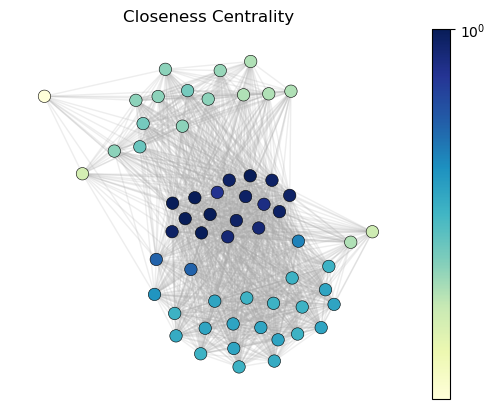
draw(g, layout, nx.eigenvector_centrality(g), 'Eigenvector Centrality')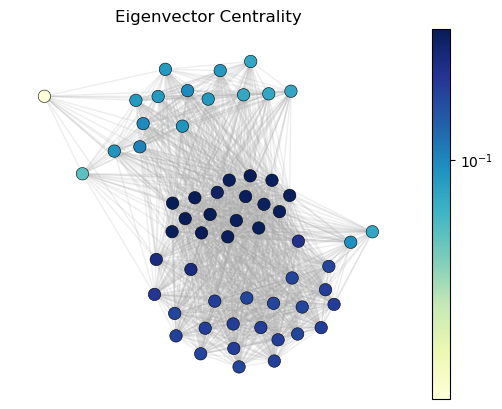
draw(g, layout, nx.pagerank(g, alpha=0.85), 'PageRank Centrality')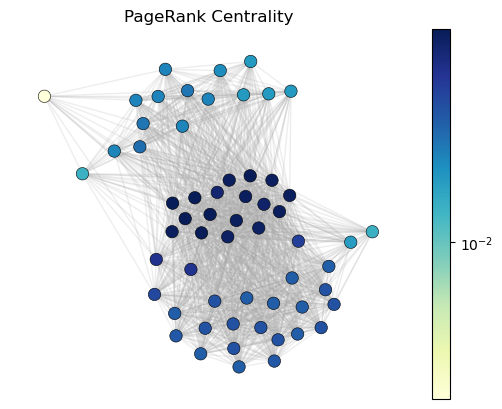
draw(g, layout, nx.clustering(g), 'Clustering coefficient')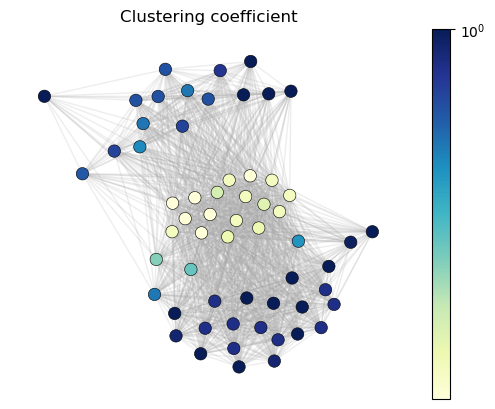
draw(g, layout, nx.average_neighbor_degree(g), 'Average Neighbor Degree')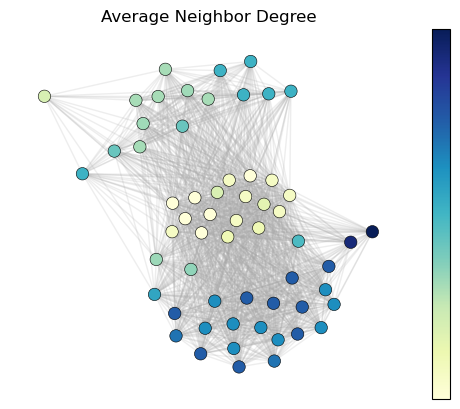
hubs_dict, auth_dict = nx.hits(g, max_iter=100)draw(g, layout, hubs_dict, 'HITS Hubs')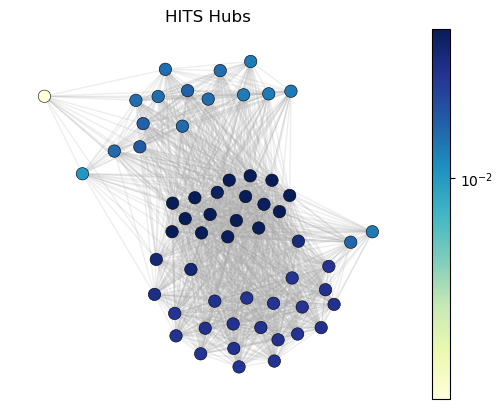
draw(g, layout, auth_dict, 'HITS Hubs')
draw(g, layout, nx.number_of_cliques(g), 'Number of Cliques')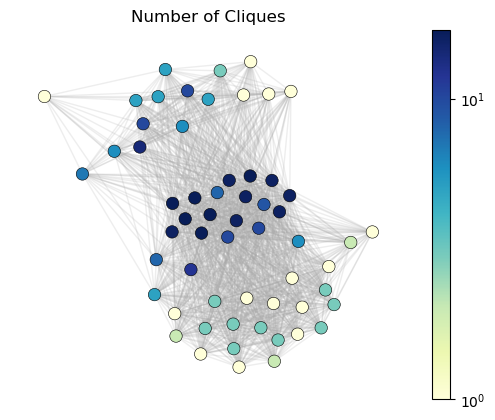
draw(g, layout, nx.harmonic_centrality(g), 'Harmonic Centrality')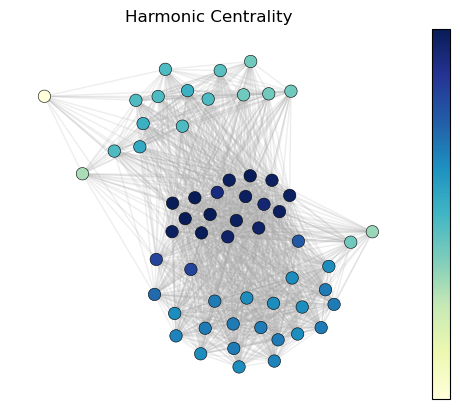
draw(g, layout, nx.load_centrality(g), 'Load Centrality')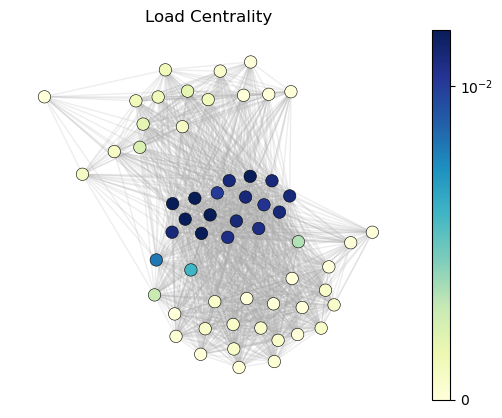
Homework
Question 1: Identify nodes with the highest degree centrality. What insights can you draw from these nodes given the context of COVID variants?
Question 2: Would betweenness centrality would be an ideal metric to capture useful information from this system? Explain your answer.
Question 3: Given a specific network, describe the characteristics of the network that would make each of the centrality measures studied here more relevant or suitable than others.
Question 4: Now that you have a deeper understanding of networks, explain the usefulness and limitations of network analysis for the area of your study/expertise.
Question 5: What insights can network centralities provide about the formation, robustness, and control of a network?