import numpy as np
import pandas as pd
import matplotlib.pyplot as plt
import matplotlib as mpl
%matplotlib inline

import networkx as nxNetwork Science - UDD
Network projections
Cristian Candia-Castro Vallejos, Ph.D.\(^{1,2,3,4}\)
Yessica Herrera-Guzmán, Ph.D.\(^{2, 3}\)
- [1] Data Science Institute (IDS), Universidad del Desarrollo, Chile
- [2] Northwestern Institute on Complex Systems, Kellogg School of Management, Northwestern Unviersity, USA
- [3] Centro de Investigación en Complejidad Social, Universidad del Desarrollo, Chile
- [4] Computational Research in Social Science Laboratory, Facultad de Ingeniería y Facultad de Gobierno, Universidad del Desarrollo, Chile
import matplotlib.colors as colors
from matplotlib import cm
from matplotlib.colors import ListedColormap,LinearSegmentedColormap
People who contracted COVID
This is a randomly generated dataset to illustrate the construction of heatmap on network centrality.
In this network, nodes are individuals and they are linked if they were infected with the same COVID variant.
data = pd.read_csv('COVID_people.csv')g = nx.Graph()data.head(2)| Source | Target | |
|---|---|---|
| 0 | Charlie | Sam |
| 1 | Charlie | Nina |
g = nx.from_pandas_edgelist(data, source='Source', target='Target')print(nx.info(g))Graph with 59 nodes and 1265 edgeslayout = nx.spring_layout(g, k=0.1, iterations=50)nx.draw(g)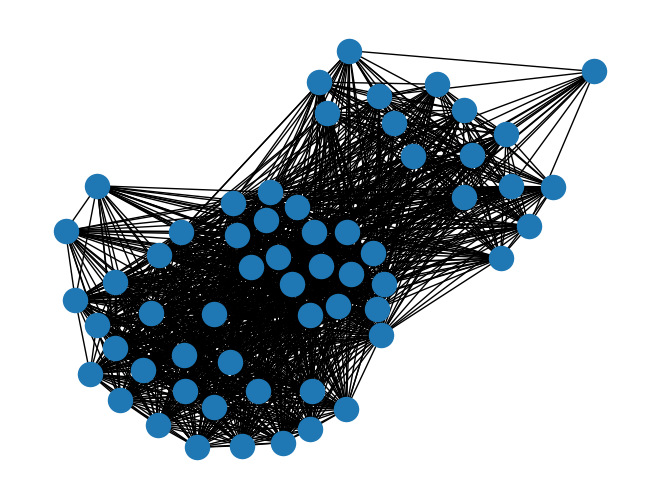
Define the function to draw the network
def draw(G, pos, measures, measure_name):

    nodes = nx.draw_networkx_nodes(g, layout, node_size=80,
                                   edgecolors='black',
                                   linewidths=0.4, cmap='YlGnBu',
                                   node_color=list(measures.values()),
                                   nodelist=measures.keys())
    nodes.set_norm(colors.SymLogNorm(linthresh=0.01, linscale=1, base=10))
    # labels = nx.draw_networkx_labels(G, pos)
    edges = nx.draw_networkx_edges(g, layout, edge_color="darkgray", alpha=0.2)

    plt.title(measure_name)
    plt.colorbar(nodes)
    plt.axis('off')
    plt.show()
draw(g, layout, nx.degree_centrality(g), 'Degree Centrality')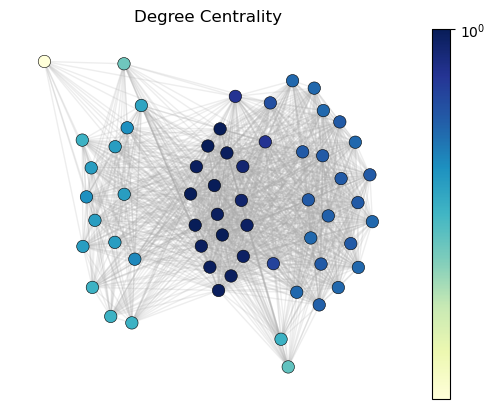
draw(g, layout, nx.betweenness_centrality(g), 'Betweenness Centrality')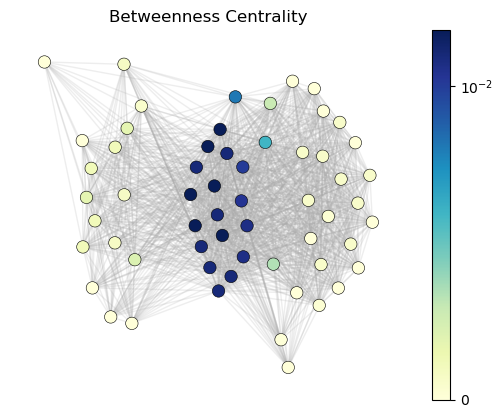
draw(g, layout, nx.closeness_centrality(g), 'Closeness Centrality')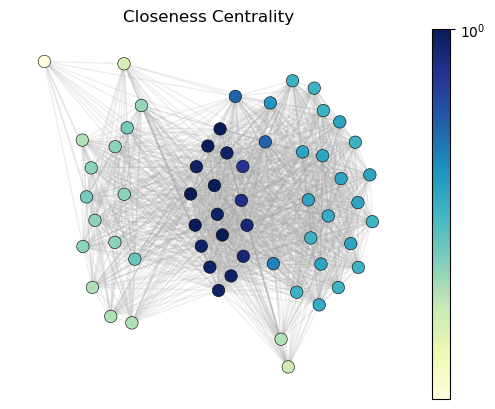
draw(g, layout, nx.eigenvector_centrality(g), 'Eigenvector Centrality')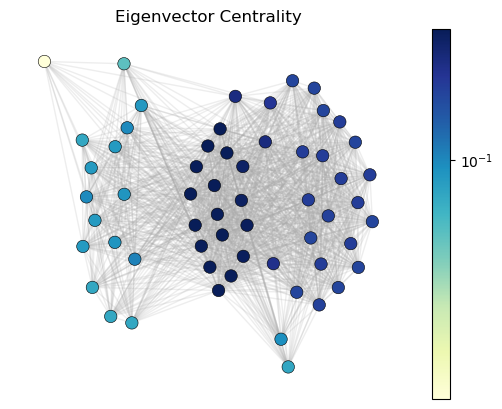
draw(g, layout, nx.pagerank(g, alpha=0.85), 'PageRank Centrality')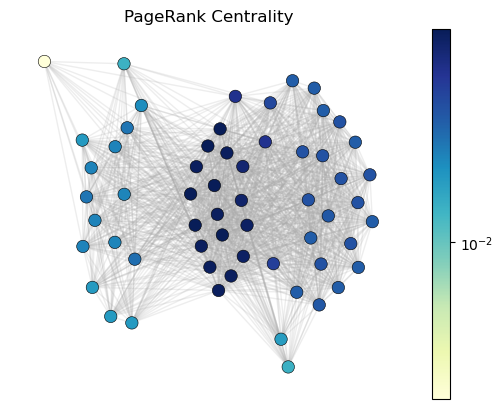
draw(g, layout, nx.clustering(g), 'Clustering coefficient')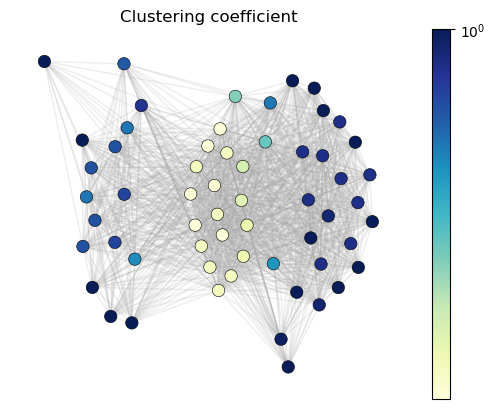
draw(g, layout, nx.average_neighbor_degree(g), 'Average Neighbor Degree')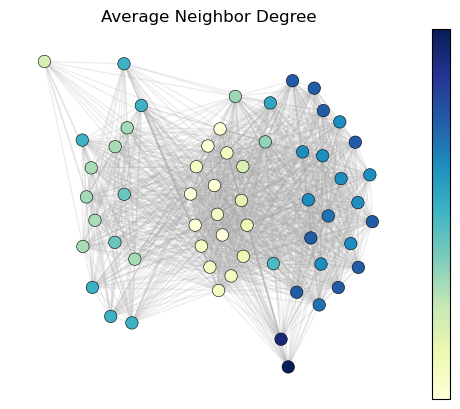
hubs_dict, auth_dict = nx.hits(g, max_iter=100)draw(g, layout, hubs_dict, 'HITS Hubs')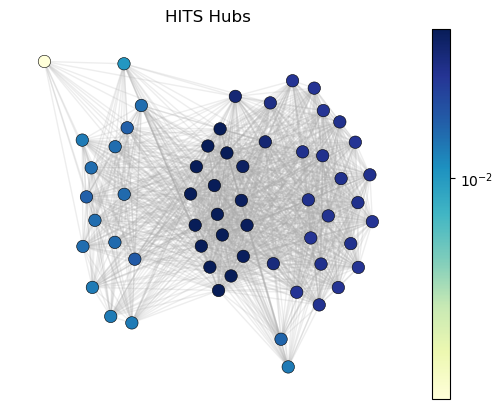
draw(g, layout, auth_dict, 'HITS Hubs')
draw(g, layout, nx.number_of_cliques(g), 'Number of Cliques')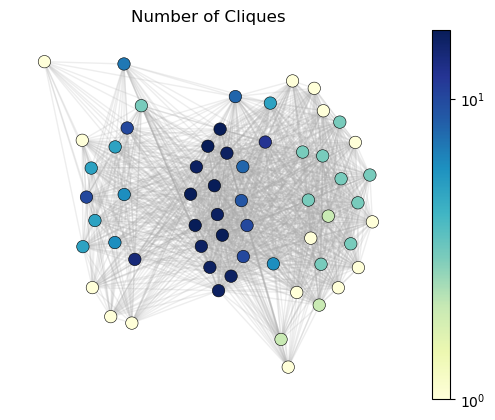
draw(g, layout, nx.harmonic_centrality(g), 'Harmonic Centrality')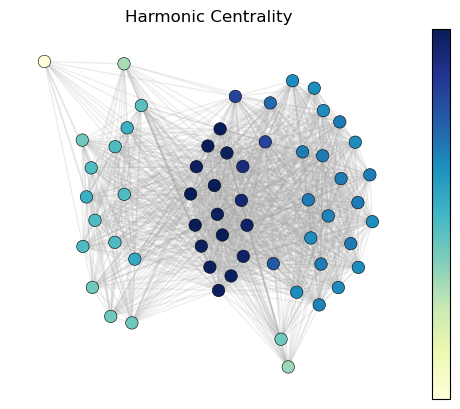
draw(g, layout, nx.load_centrality(g), 'Load Centrality')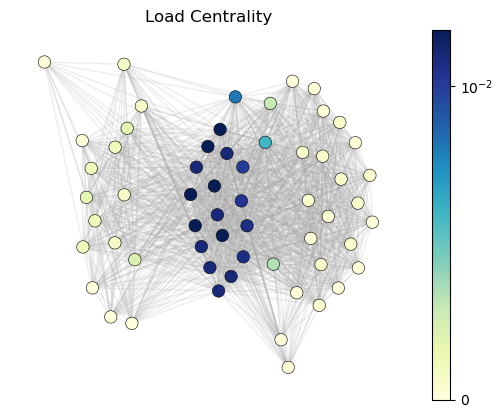
Ejercicios
Pregunta 1: Identifica los nodos con mayor centralidad de grado. ¿Qué conclusiones puedes sacar de estos nodos dada el contexto de las variantes del COVID?
Pregunta 2: ¿Sería la centralidad de intermediación una métrica ideal para capturar información útil de este sistema? Explica tu respuesta.
Pregunta 3: Dada una red específica, describe las características de la red que harían que cada una de las medidas de centralidad estudiadas aquí sea más relevante o adecuada que otras.
Pregunta 4: Ahora que tienes un entendimiento más profundo de las redes, explica la utilidad y las limitaciones del análisis de redes para el área de tu estudio/expertise.
Pregunta 5: ¿Qué conclusiones pueden proporcionar las centralidades de red sobre la formación, robustez y control de una red?